Note
Click here to download the full example code
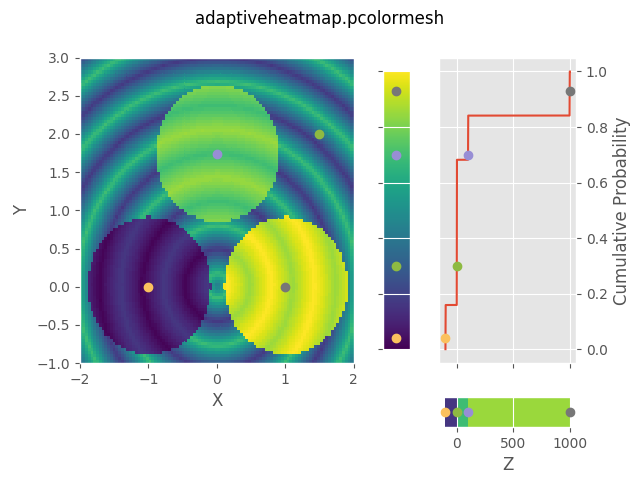
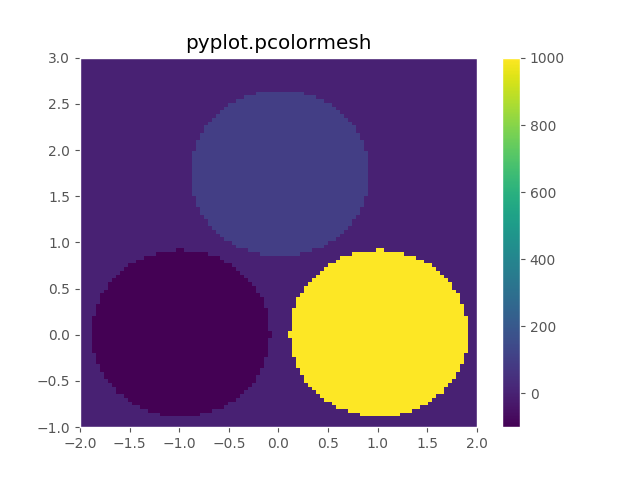
pcolormesh with demos.data_three_circles
An example data such that the detail can be visualized with
adaptiveheatmap.pcolormesh while only the large differences are
captured in matplotlib.pyplot.pcolormesh.
from matplotlib import pyplot
import numpy

from adaptiveheatmap.demos import data_three_circles
import adaptiveheatmap

pyplot.style.use("ggplot")

X, Y, Z = data_three_circles()
ah = adaptiveheatmap.pcolormesh(X, Y, Z)
ah.set_xlabel('X')
ah.set_ylabel('Y')
ah.set_zlabel('Z')
ah.relate_xyzq(0, numpy.tan(numpy.pi / 3), color='C2', noline=True)
ah.relate_xyzq(+1, 0, color='C3', noline=True)
ah.relate_xyzq(-1, 0, color='C4', noline=True)
ah.relate_xyzq(1.5, 2, color='C5', noline=True)
ah.figure.suptitle('adaptiveheatmap.pcolormesh')

pyplot.figure()
pyplot.pcolormesh(X, Y, Z)
pyplot.title('pyplot.pcolormesh')
pyplot.colorbar()

pyplot.show()
Total running time of the script: ( 0 minutes 0.139 seconds)