Note
Click here to download the full example code
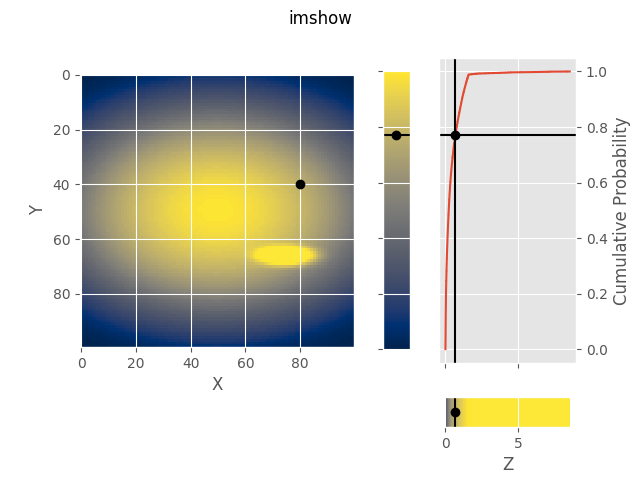
imshow demo
imshow can be used like matplotlib.pyplot.imshow.
from matplotlib import pyplot

from adaptiveheatmap.demos import data_hump_and_spike
import adaptiveheatmap

pyplot.style.use("ggplot")

_X, _Y, Z = data_hump_and_spike()
ah = adaptiveheatmap.imshow(Z, cmap='cividis')
ah.set_xlabel('X')
ah.set_ylabel('Y')
ah.set_zlabel('Z')
ah.relate_xyzq(80, 40)
ah.figure.suptitle('imshow')

pyplot.show()
Total running time of the script: ( 0 minutes 0.079 seconds)