Note
Click here to download the full example code
hist2d demo
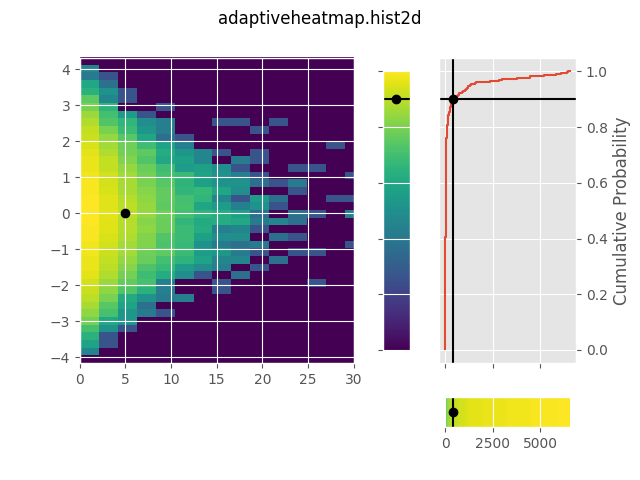
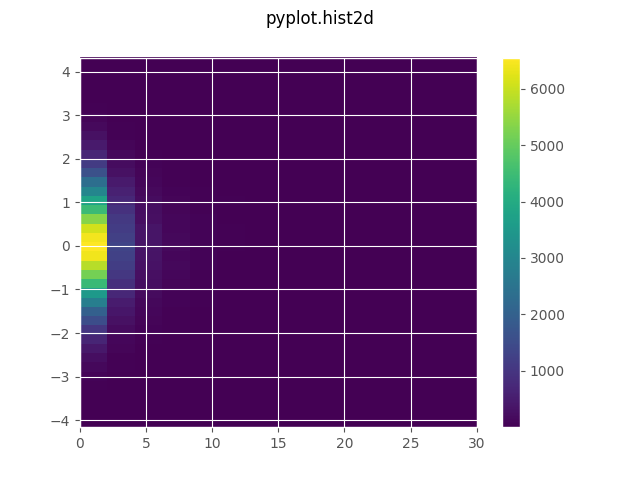
hist2d can be used like matplotlib.pyplot.hist2d.
See also: https://matplotlib.org/examples/pylab_examples/hist2d_log_demo.html
from matplotlib import pyplot
import numpy

import adaptiveheatmap

pyplot.style.use("ggplot")

x = numpy.exp(numpy.random.randn(100000))
y = numpy.random.randn(100000)
ah = adaptiveheatmap.hist2d(x, y, bins=40, vmin=1)
ah.relate_xyzq(5, 0)
ah.figure.suptitle('adaptiveheatmap.hist2d')
ah.ax_main.set_xlim(xmax=30)

pyplot.figure()
pyplot.hist2d(x, y, bins=40, vmin=1)
pyplot.colorbar()
pyplot.suptitle('pyplot.hist2d')
pyplot.xlim(xmax=30)

pyplot.show()
Total running time of the script: ( 0 minutes 0.154 seconds)