Note
Click here to download the full example code
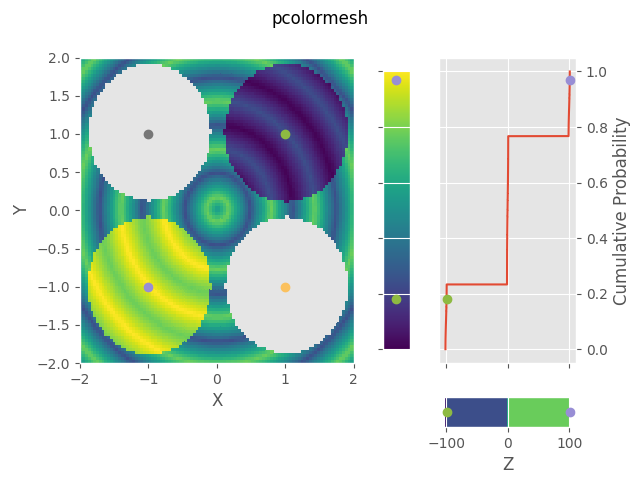
pcolormesh with demos.data_circles_and_nans
Data containing NaNs.
from matplotlib import pyplot

from adaptiveheatmap.demos import data_circles_and_nans
import adaptiveheatmap

pyplot.style.use("ggplot")

X, Y, Z = data_circles_and_nans()
ah = adaptiveheatmap.pcolormesh(X, Y, Z)
ah.set_xlabel('X')
ah.set_ylabel('Y')
ah.set_zlabel('Z')
ah.relate_xyzq(-1, -1, color='C2', noline=True)
ah.relate_xyzq(-1, +1, color='C3', noline=True)
ah.relate_xyzq(+1, -1, color='C4', noline=True)
ah.relate_xyzq(+1, +1, color='C5', noline=True)
ah.figure.suptitle('pcolormesh')

pyplot.show()
Total running time of the script: ( 0 minutes 0.133 seconds)