API reference
imshow(*args, **kwargs) |
Adaptive heatmap version of Axes.imshow. |
matshow(*args, **kwargs) |
Adaptive heatmap version of Axes.matshow. |
pcolor(*args, **kwargs) |
Adaptive heatmap version of Axes.pcolor. |
pcolormesh(*args, **kwargs) |
Adaptive heatmap version of Axes.pcolormesh. |
hexbin(*args, **kwargs) |
Adaptive heatmap version of Axes.hexbin. |
hist2d(*args, **kwargs) |
Adaptive heatmap version of Axes.hist2d. |
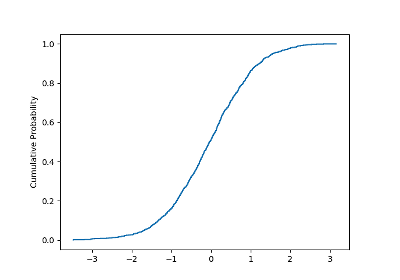
cumhist(data[, normed, ylabel, ax]) |
Plot cumulative distribution of data. |
High-level interface
-
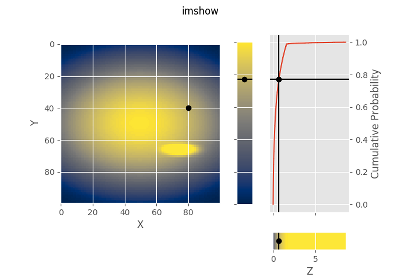
adaptiveheatmap.imshow(*args, **kwargs)¶ Adaptive heatmap version of
Axes.imshow.Parameters: - *args –
- **kwargs – All positional and keyword arguments are passed to
Axes.imshowand use its default, except for the following keyword arguments. - norm (QuantileNormalize) – Unlike
Axes.imshow,normhere defaults to an instance ofQuantileNormalizeinitialized with the data passed to this function. - norm_kw (dict) – Keyword arguments passed to
QuantileNormalize. - ah_kw (dict) – Keyword arguments passed to
AdaptiveHeatmap.make.
Returns: ah –
ah.resultholds whateverAxes.imshowreturns.Return type: Examples
-
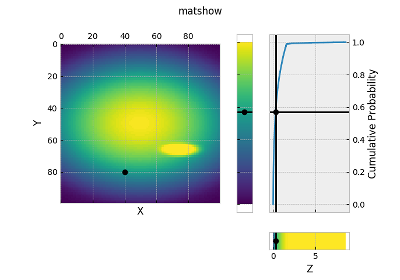
adaptiveheatmap.matshow(*args, **kwargs)¶ Adaptive heatmap version of
Axes.matshow.Parameters: - *args –
- **kwargs – All positional and keyword arguments are passed to
Axes.matshowand use its default, except for the following keyword arguments. - norm (QuantileNormalize) – Unlike
Axes.matshow,normhere defaults to an instance ofQuantileNormalizeinitialized with the data passed to this function. - norm_kw (dict) – Keyword arguments passed to
QuantileNormalize. - ah_kw (dict) – Keyword arguments passed to
AdaptiveHeatmap.make.
Returns: ah –
ah.resultholds whateverAxes.matshowreturns.Return type: Examples
-
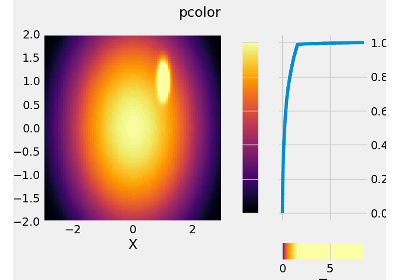
adaptiveheatmap.pcolor(*args, **kwargs)¶ Adaptive heatmap version of
Axes.pcolor.Parameters: - *args –
- **kwargs – All positional and keyword arguments are passed to
Axes.pcolorand use its default, except for the following keyword arguments. - norm (QuantileNormalize) – Unlike
Axes.pcolor,normhere defaults to an instance ofQuantileNormalizeinitialized with the data passed to this function. - norm_kw (dict) – Keyword arguments passed to
QuantileNormalize. - ah_kw (dict) – Keyword arguments passed to
AdaptiveHeatmap.make.
Returns: ah –
ah.resultholds whateverAxes.pcolorreturns.Return type: Examples
-
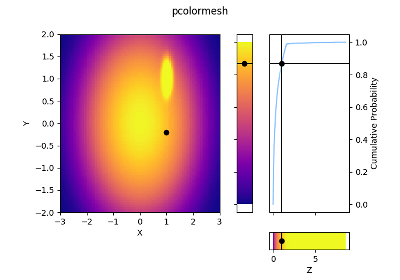
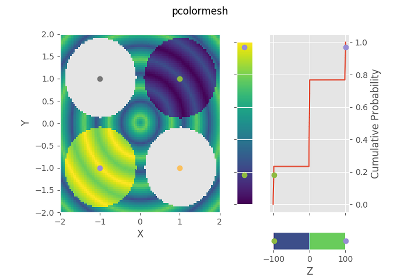
adaptiveheatmap.pcolormesh(*args, **kwargs)¶ Adaptive heatmap version of
Axes.pcolormesh.Parameters: - *args –
- **kwargs – All positional and keyword arguments are passed to
Axes.pcolormeshand use its default, except for the following keyword arguments. - norm (QuantileNormalize) – Unlike
Axes.pcolormesh,normhere defaults to an instance ofQuantileNormalizeinitialized with the data passed to this function. - norm_kw (dict) – Keyword arguments passed to
QuantileNormalize. - ah_kw (dict) – Keyword arguments passed to
AdaptiveHeatmap.make.
Returns: ah –
ah.resultholds whateverAxes.pcolormeshreturns.Return type: Examples

-
adaptiveheatmap.hexbin(*args, **kwargs)¶ Adaptive heatmap version of
Axes.hexbin.Parameters: - *args –
- **kwargs – All positional and keyword arguments are passed to
Axes.hexbinand use its default, except for the following keyword arguments. - norm (QuantileNormalize) – Unlike
Axes.hexbin,normhere defaults to an instance ofQuantileNormalizeinitialized with the data passed to this function. - norm_kw (dict) – Keyword arguments passed to
QuantileNormalize. - ah_kw (dict) – Keyword arguments passed to
AdaptiveHeatmap.make.
Returns: ah –
ah.resultholds whateverAxes.hexbinreturns.Return type: Examples
-
adaptiveheatmap.hist2d(*args, **kwargs)¶ Adaptive heatmap version of
Axes.hist2d.Parameters: - *args –
- **kwargs – All positional and keyword arguments are passed to
Axes.hist2dand use its default, except for the following keyword arguments. - norm (QuantileNormalize) – Unlike
Axes.hist2d,normhere defaults to an instance ofQuantileNormalizeinitialized with the data passed to this function. - norm_kw (dict) – Keyword arguments passed to
QuantileNormalize. - ah_kw (dict) – Keyword arguments passed to
AdaptiveHeatmap.make.
Returns: ah –
ah.resultholds whateverAxes.hist2dreturns.Return type: Examples
Low-level interface
-
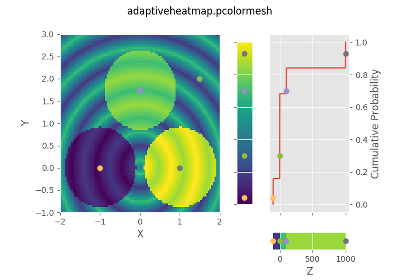
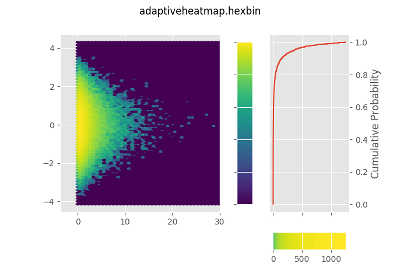
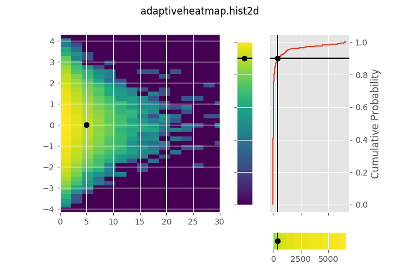
class
adaptiveheatmap.AdaptiveHeatmap(ax_main, ax_cdf, cax_quantile, cax_original, gs=None)¶ Four-panel figure for visualizing heatmaps.
-
ax_main¶ matplotlib.axes.Axes– Axes to plot the heatmap.
-
ax_cdf¶ matplotlib.axes.Axes– Axes to plot the cumulative distribution function (CDF).
-
cax_quantile¶ matplotlib.axes.Axes– Vertical colorbar along the cumulative distribution function (CDF) axis.
-
cax_original¶ matplotlib.axes.Axes– Horizontal colorbar in the original Z-space.
-
figure
-
norm
-
contour(*args, **kwargs)¶ Run
Axes.contourwith adaptive heatmap colorbar.Parameters: - *args –
- **kwargs – All positional and keyword arguments are passed to
Axes.contourand use its default, except for the following keyword arguments. - norm (QuantileNormalize) – Unlike
Axes.contour,normhere defaults to an instance ofQuantileNormalizeinitialized with the data passed to this function. - norm_kw (dict) – Keyword arguments passed to
QuantileNormalize.
Returns: Return type: Whatever
Axes.contourreturns.
-
contourf(*args, **kwargs)¶ Run
Axes.contourfwith adaptive heatmap colorbar.Parameters: - *args –
- **kwargs – All positional and keyword arguments are passed to
Axes.contourfand use its default, except for the following keyword arguments. - norm (QuantileNormalize) – Unlike
Axes.contourf,normhere defaults to an instance ofQuantileNormalizeinitialized with the data passed to this function. - norm_kw (dict) – Keyword arguments passed to
QuantileNormalize.
Returns: Return type: Whatever
Axes.contourfreturns.
-
hexbin(*args, **kwargs)¶ Run
Axes.hexbinwith adaptive heatmap colorbar.Parameters: - *args –
- **kwargs – All positional and keyword arguments are passed to
Axes.hexbinand use its default, except for the following keyword arguments. - norm (QuantileNormalize) – Unlike
Axes.hexbin,normhere defaults to an instance ofQuantileNormalizeinitialized with the data passed to this function. - norm_kw (dict) – Keyword arguments passed to
QuantileNormalize.
Returns: Return type: Whatever
Axes.hexbinreturns.
-
hist2d(*args, **kwargs)¶ Run
Axes.hist2dwith adaptive heatmap colorbar.Parameters: - *args –
- **kwargs – All positional and keyword arguments are passed to
Axes.hist2dand use its default, except for the following keyword arguments. - norm (QuantileNormalize) – Unlike
Axes.hist2d,normhere defaults to an instance ofQuantileNormalizeinitialized with the data passed to this function. - norm_kw (dict) – Keyword arguments passed to
QuantileNormalize.
Returns: Return type: Whatever
Axes.hist2dreturns.
-
imshow(*args, **kwargs)¶ Run
Axes.imshowwith adaptive heatmap colorbar.Parameters: - *args –
- **kwargs – All positional and keyword arguments are passed to
Axes.imshowand use its default, except for the following keyword arguments. - norm (QuantileNormalize) – Unlike
Axes.imshow,normhere defaults to an instance ofQuantileNormalizeinitialized with the data passed to this function. - norm_kw (dict) – Keyword arguments passed to
QuantileNormalize.
Returns: Return type: Whatever
Axes.imshowreturns.
-
classmethod
make(cax_quantile_width_ratio=0.1, ax_cdf_width_ratio=0.5, cax_original_height_ratio=0.1, figure=None, **kwargs)¶ Create an
AdaptiveHeatmapusingGridSpec.Parameters: - cax_original_height_ratio (float) – The ratio of the height of
cax_originaltoax_main. - cax_quantile_width_ratio (float) – The ratio of the width of
cax_quantiletoax_main. - ax_cdf_width_ratio (float) – The ratio of the width of
ax_quantiletoax_main.
- cax_original_height_ratio (float) – The ratio of the height of
-
matshow(*args, **kwargs)¶ Run
Axes.matshowwith adaptive heatmap colorbar.Parameters: - *args –
- **kwargs – All positional and keyword arguments are passed to
Axes.matshowand use its default, except for the following keyword arguments. - norm (QuantileNormalize) – Unlike
Axes.matshow,normhere defaults to an instance ofQuantileNormalizeinitialized with the data passed to this function. - norm_kw (dict) – Keyword arguments passed to
QuantileNormalize.
Returns: Return type: Whatever
Axes.matshowreturns.
-
pcolor(*args, **kwargs)¶ Run
Axes.pcolorwith adaptive heatmap colorbar.Parameters: - *args –
- **kwargs – All positional and keyword arguments are passed to
Axes.pcolorand use its default, except for the following keyword arguments. - norm (QuantileNormalize) – Unlike
Axes.pcolor,normhere defaults to an instance ofQuantileNormalizeinitialized with the data passed to this function. - norm_kw (dict) – Keyword arguments passed to
QuantileNormalize.
Returns: Return type: Whatever
Axes.pcolorreturns.
-
pcolormesh(*args, **kwargs)¶ Run
Axes.pcolormeshwith adaptive heatmap colorbar.Parameters: - *args –
- **kwargs – All positional and keyword arguments are passed to
Axes.pcolormeshand use its default, except for the following keyword arguments. - norm (QuantileNormalize) – Unlike
Axes.pcolormesh,normhere defaults to an instance ofQuantileNormalizeinitialized with the data passed to this function. - norm_kw (dict) – Keyword arguments passed to
QuantileNormalize.
Returns: Return type: Whatever
Axes.pcolormeshreturns.
-
relate_xyzq(x, y, marker='o', color='k', noline=False)¶ Plot auxiliary lines and points to relate data at
(x, y).
-
set_zlabel(label)¶ Set “z-axis” label of
cax_quantile.
-
-
class
adaptiveheatmap.QuantileNormalize(qs=None, quantile=None, **kwargs)¶ Data normalization based on quantile function (inverse CDF).
-
qs¶ None, int or array – If an int,
qs-quantiles are used; i.e., it is converted to an array byqs = numpy.linspace(0, 1, qs + 1). If an array, it must be an increasing sequence of numbers between 0 and 1 (qs * 100is passed tonumpy.nanpercentile). Note that usuallyqsshould start at 0 (qs[0] == 0) and end at 1 (qs[-1] == 1) unless it is preferred to ignore extreme values.
-
quantile¶ array – Sorted values on the original data space.
-
vmin, vmax float
-
clip¶ bool – See:
matplotlib.colors.Normalize.
-
autoscale(data)¶ Set vmin, vmax to min, max of A.
-
autoscale_None(data)¶ autoscale only None-valued vmin or vmax.
-
scaled()¶ return true if vmin and vmax set
-